Total Messages
Track the total number of messages sent and received across all your WhatsApp accounts.
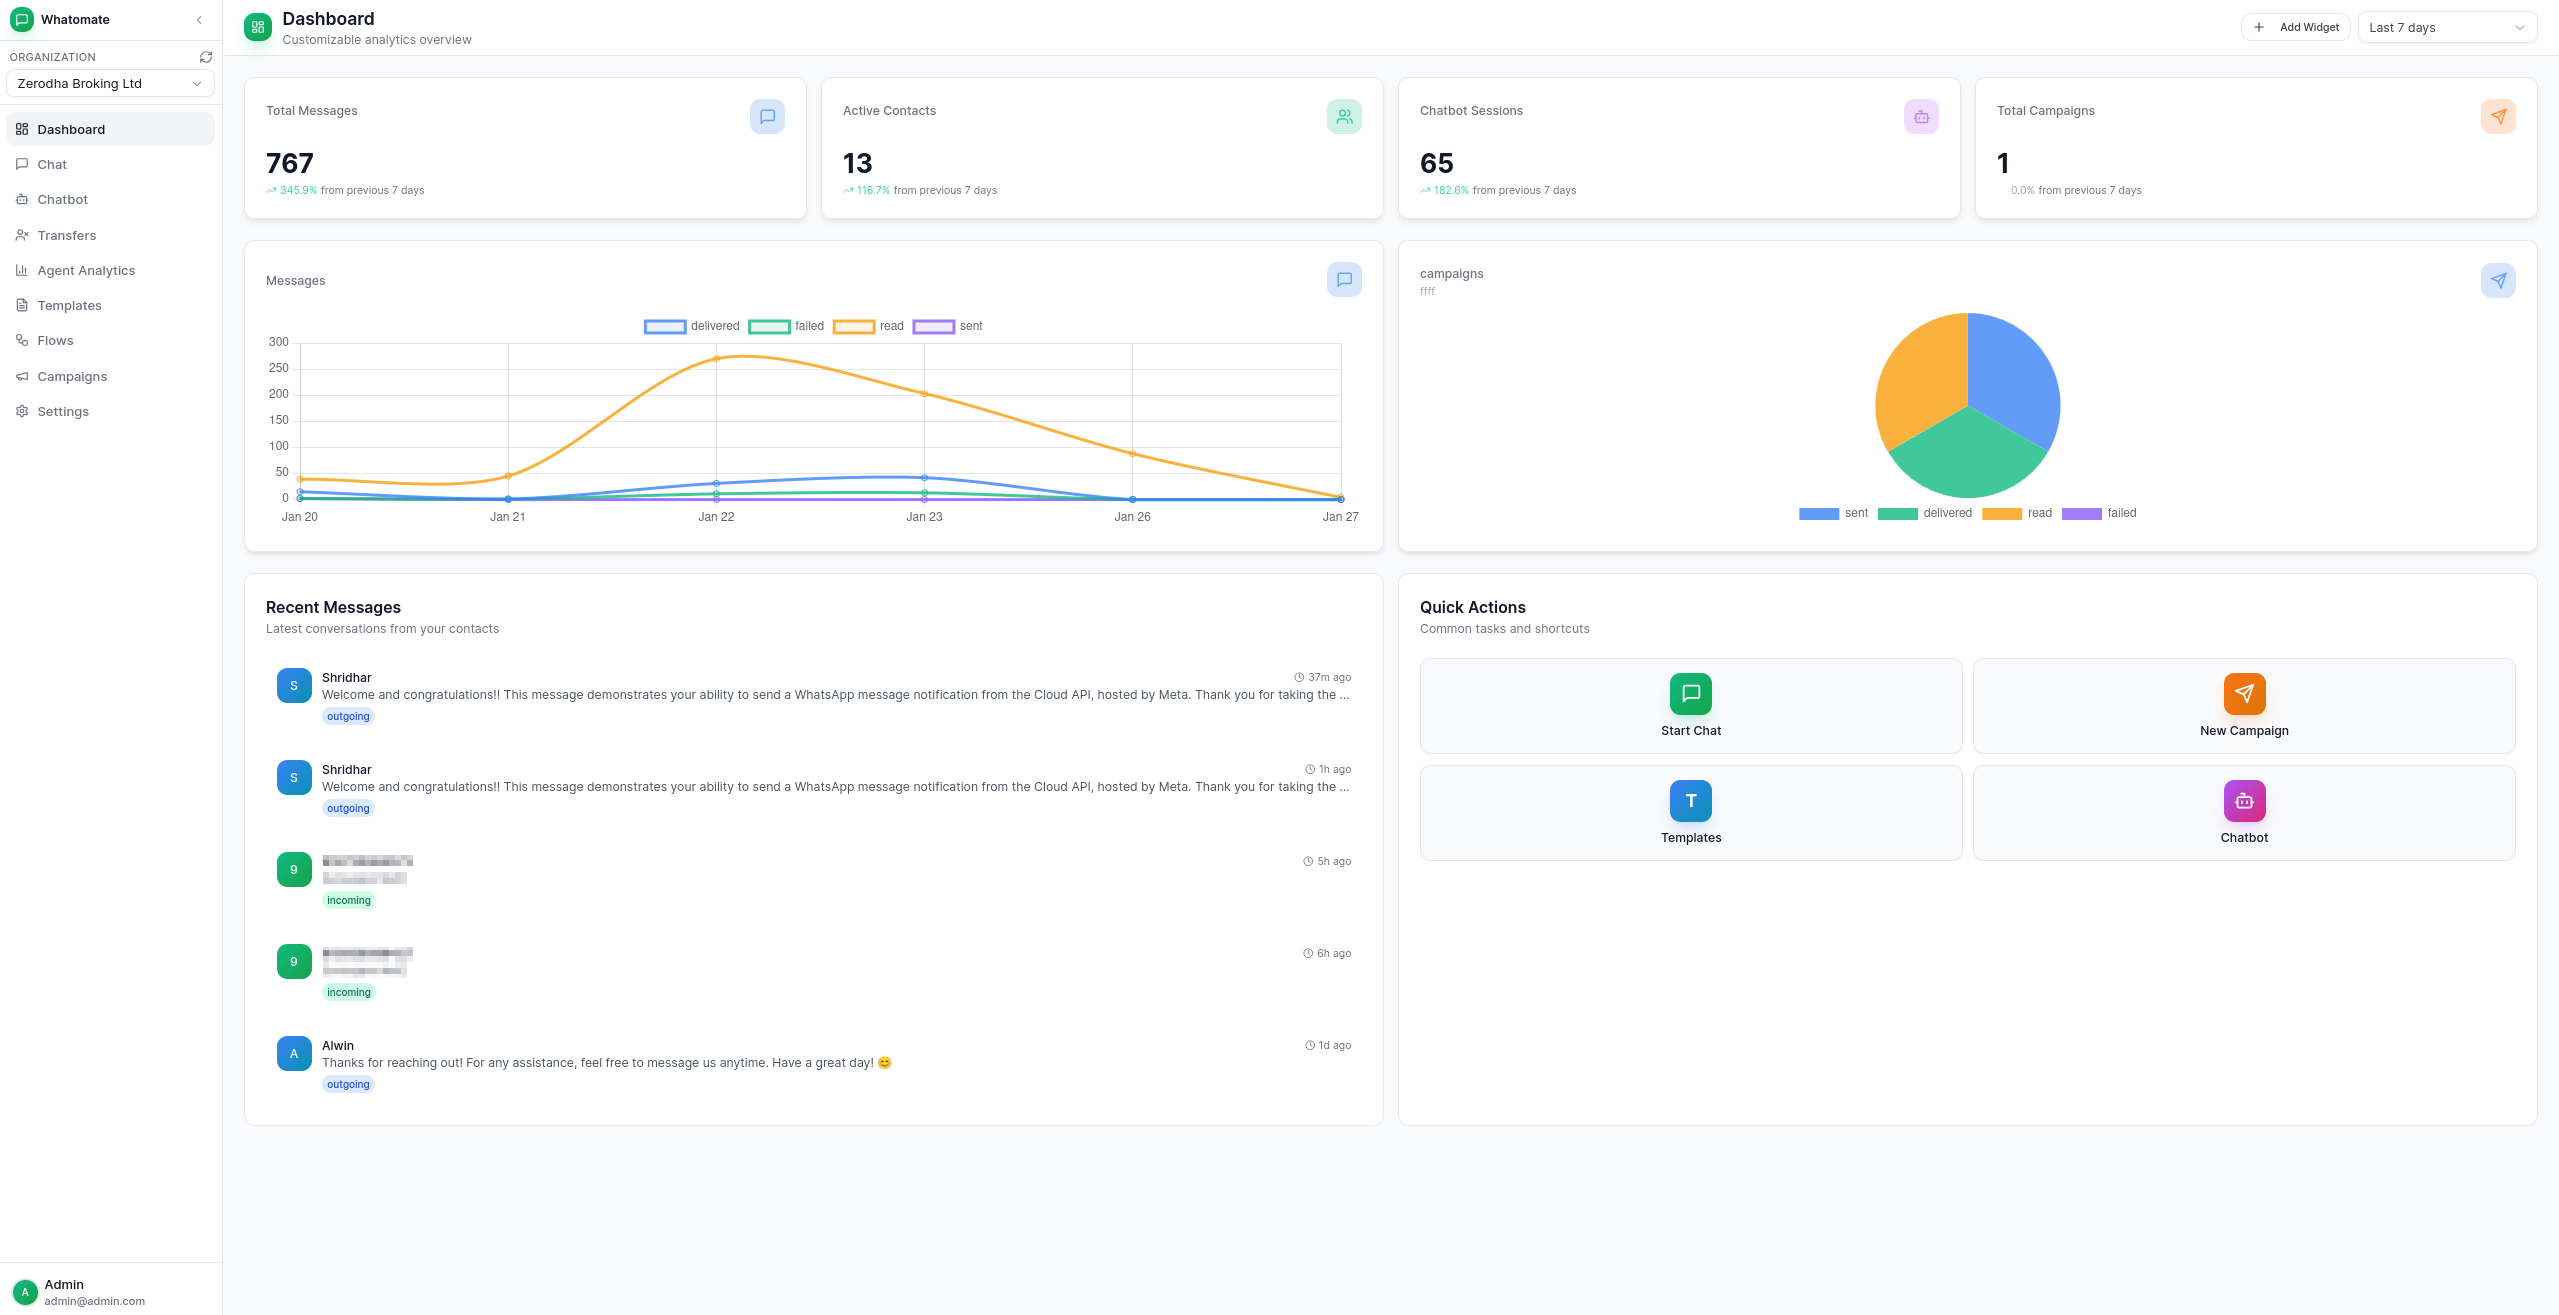
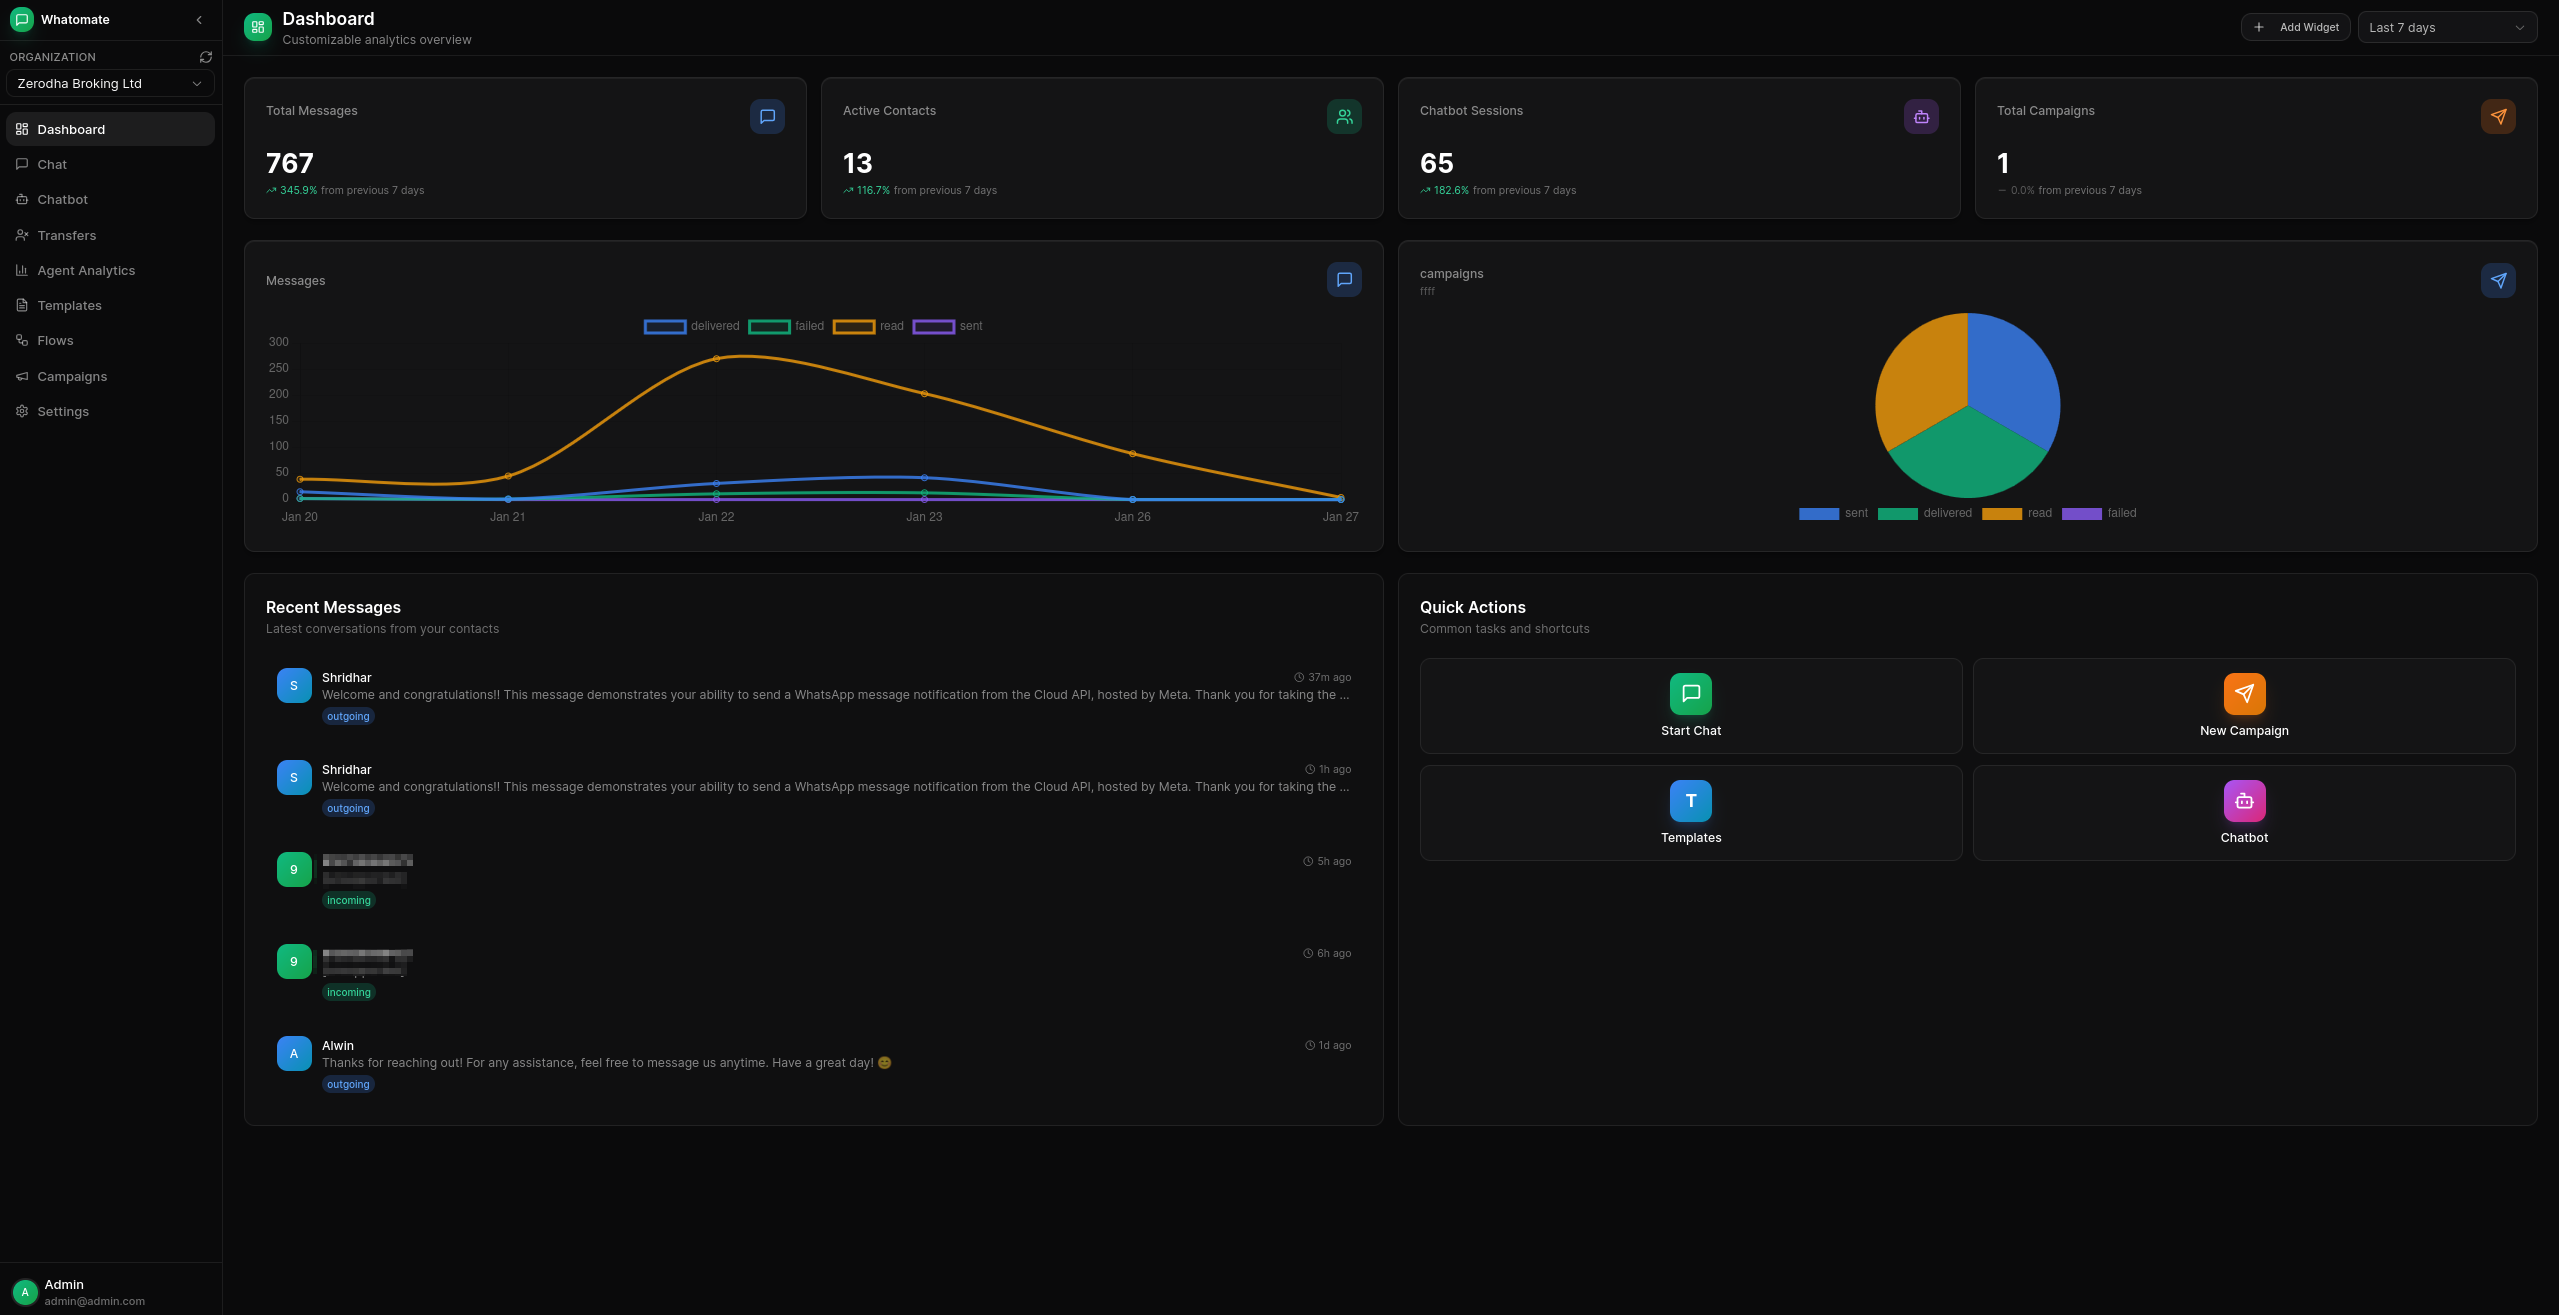
The Dashboard provides a comprehensive view of your WhatsApp business operations. Monitor key metrics, track conversations, and stay on top of your messaging activities.
Total Messages
Track the total number of messages sent and received across all your WhatsApp accounts.
Active Conversations
Monitor ongoing conversations with your customers in real-time.
Campaign Performance
View the success rate and engagement metrics of your bulk messaging campaigns.
Chatbot Analytics
Analyze how your automated responses are performing.
Build your own analytics widgets to track the metrics that matter most. Click Add Widget to open the widget builder.
Each widget is configured with:
number (single value card), percentage (value shown as a percentage), chart, table (tabular breakdown), or shortcuts (a static quick-actions tile that needs no data source)Widgets can be edited or deleted by their owner using the icons that appear on hover.
The dashboard is a resizable grid. Each widget stores its own grid position and size (grid_x, grid_y, grid_w, grid_h). Drag a widget to reposition it or drag its edge to resize; the new arrangement is persisted in one bulk save so your layout is restored on the next visit.
When creating a chart widget, select a Group By field to split the data by distinct values of that field.
| Chart Type | Without Group By | With Group By |
|---|---|---|
| Line | Single line over time | Multiple lines — one per group value |
| Bar | Bars over time | Bars for each group value |
| Pie | Slices over time | Slices for each group value |
Available group-by fields per data source:
For example, a pie chart on the campaigns data source grouped by message_status shows slices for sent, delivered, read, and failed message totals across all campaigns in the selected period.
Filter your metrics by different time ranges:
All widgets and dashboard metrics reflect the selected time period. Number widgets also show a percentage change compared to the previous period. Your filter preference is saved locally and persists across sessions.
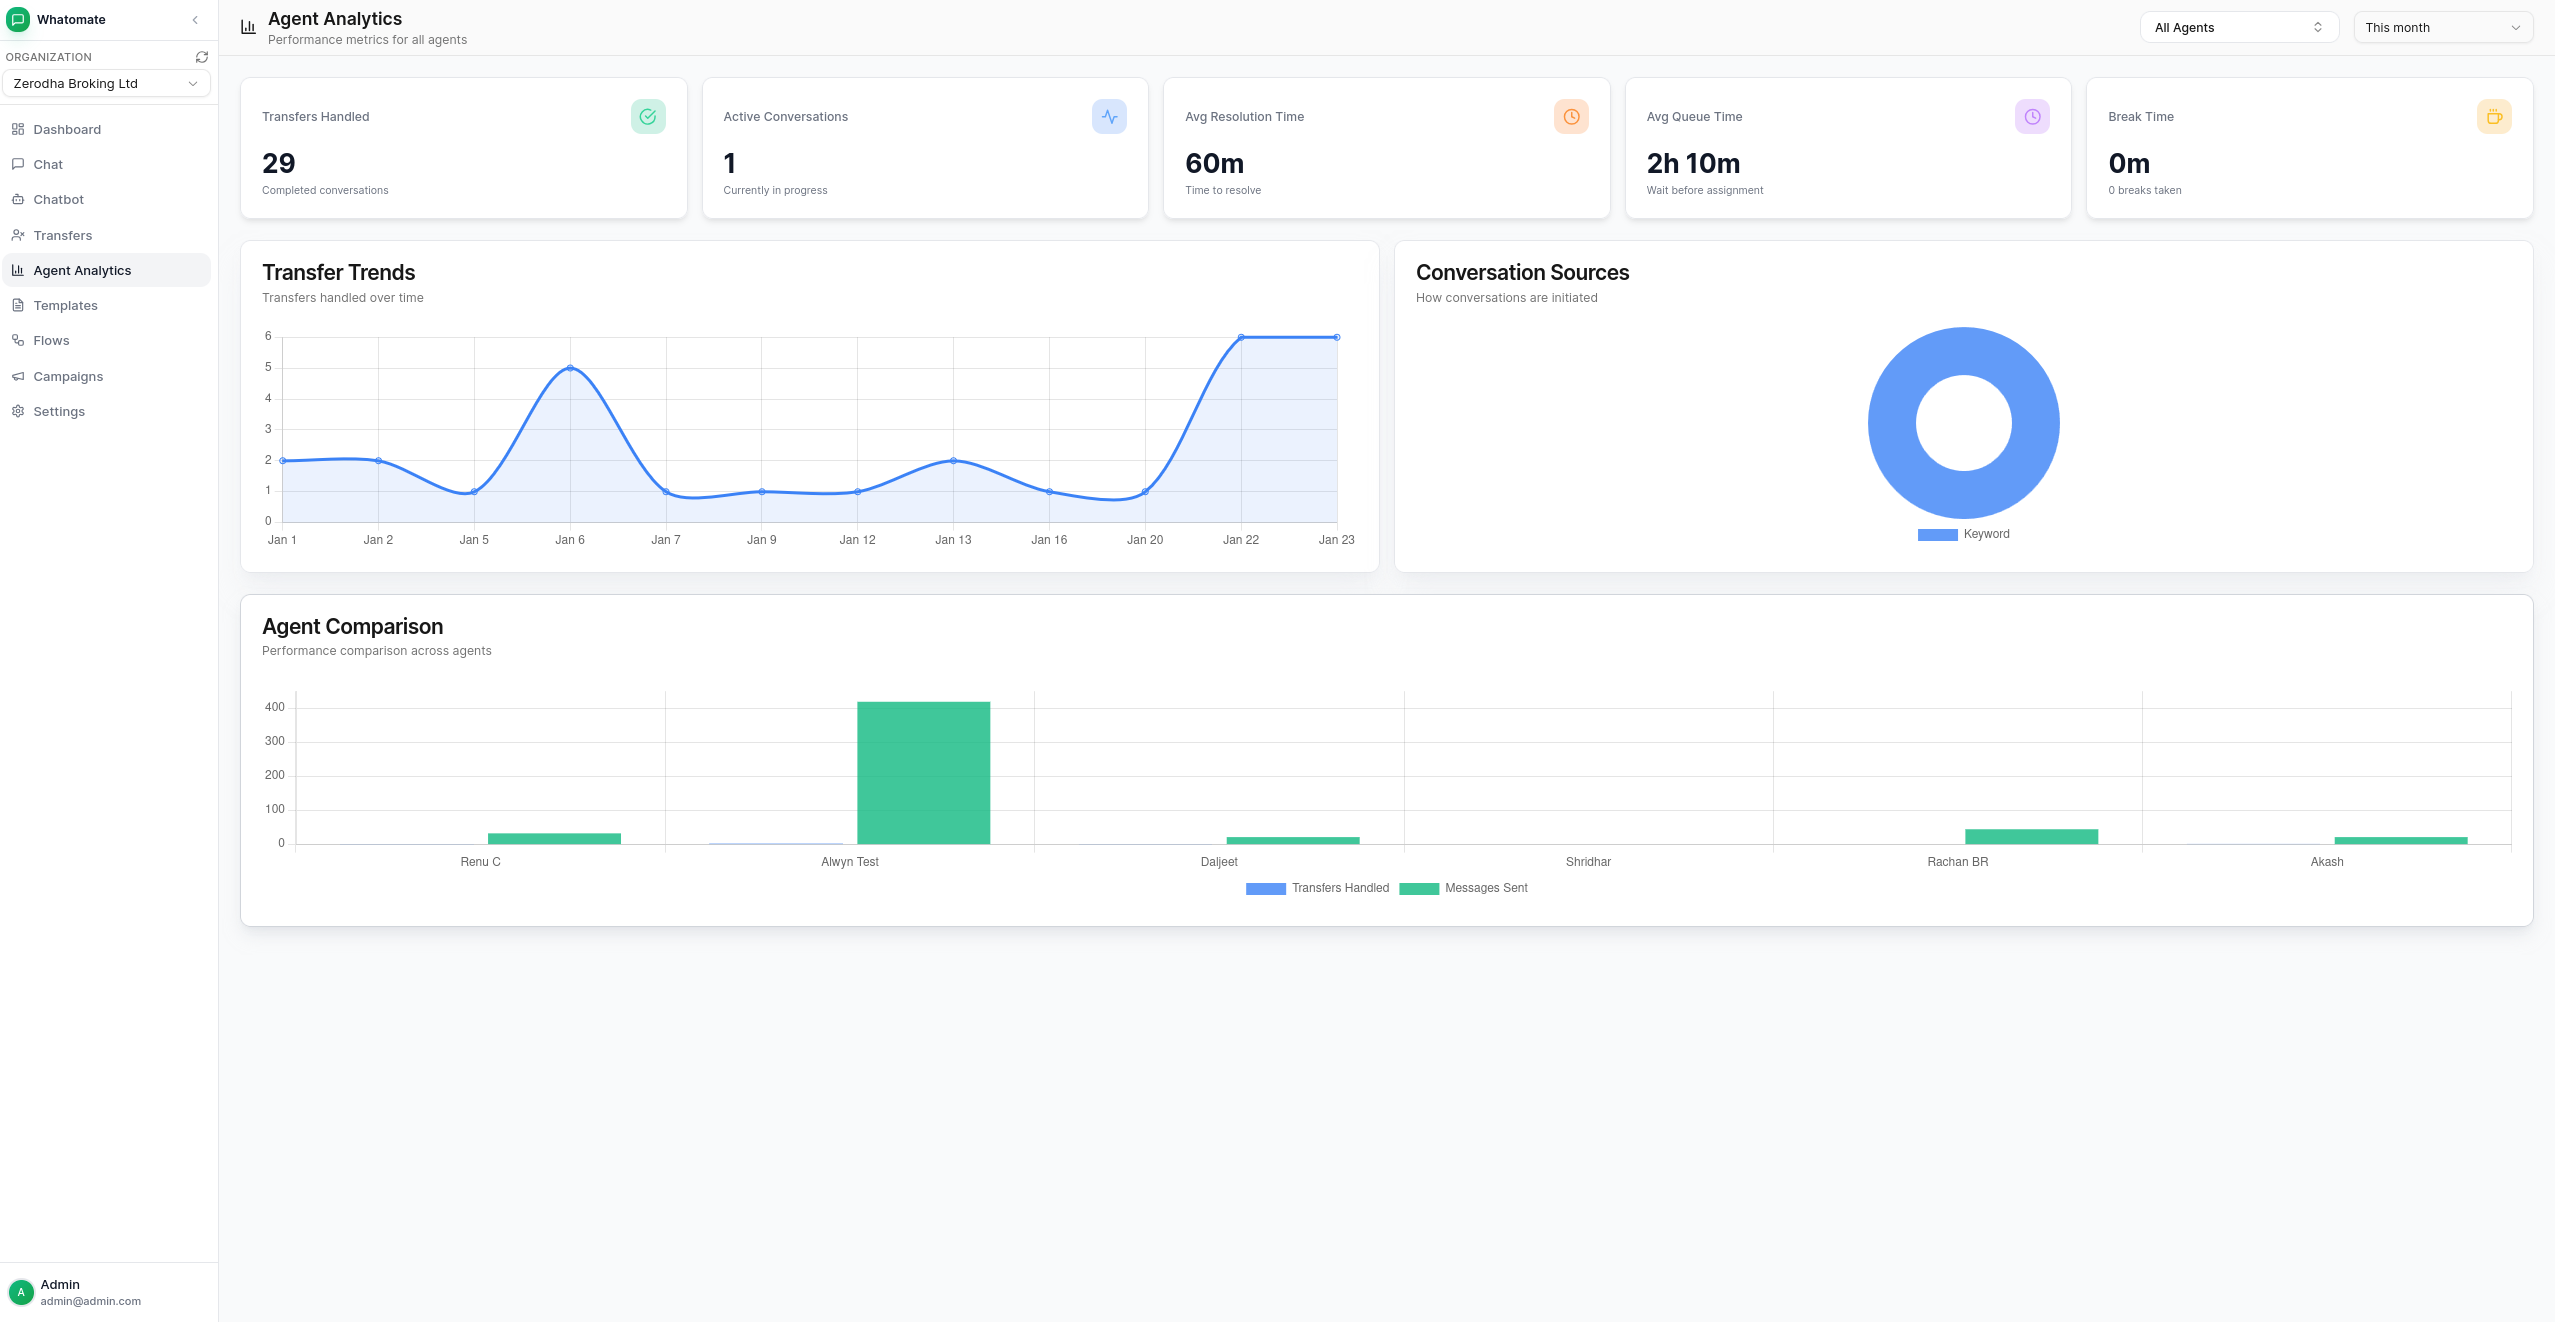
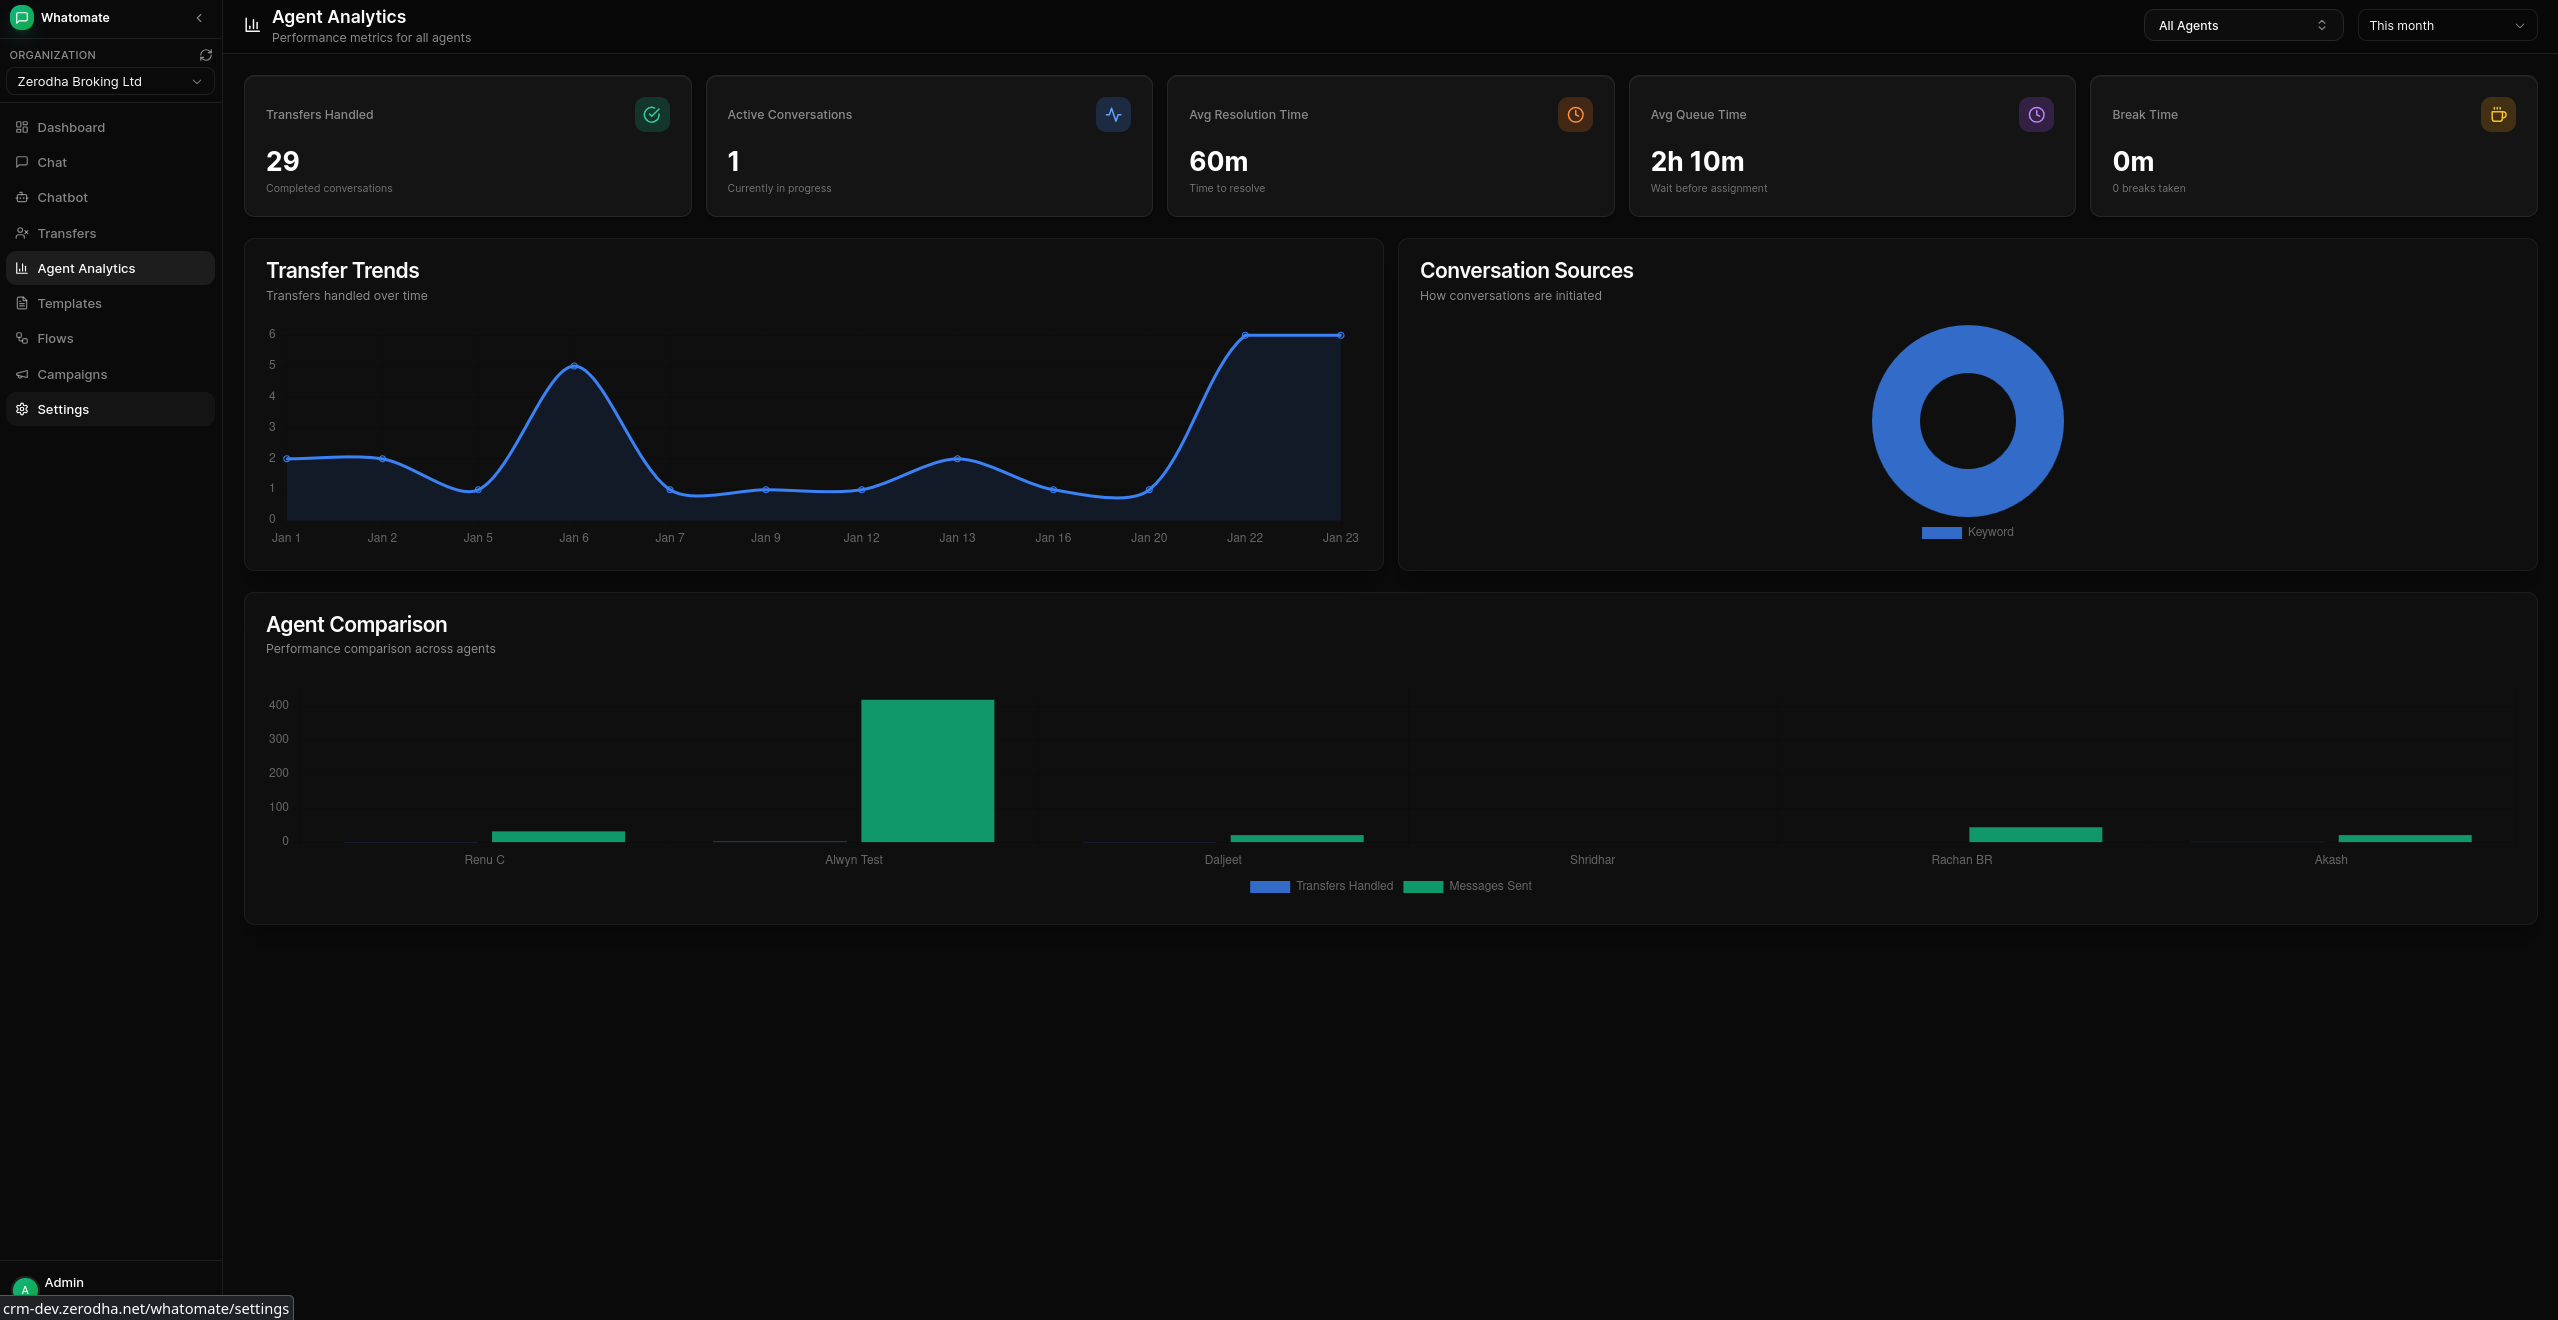
The Agent Analytics page provides performance metrics for your support team, including transfers handled, active conversations, average resolution time, queue time, and break time. It also shows transfer trends over time, conversation source breakdowns, and agent-by-agent comparisons.
Access frequently used actions directly from the dashboard: